
By
Melisa Mutlu
on 13/08/2026, 13:20
Last updated on 8/28/26, 1:08 PM

Time Between Statuses tracks how long an issue takes to move from one Jira status to another, for example from "In Progress" to "Done," or from "Ready for Review" to "Approved."
Statuses are one of the most important parts of core architecture in Jira, and it logs every status change in an issue's (work item) history. But it doesn't turn that history into a duration you can see, sort, or filter by on its own.
This guide covers what Time Between Statuses actually measures, how it's different from Time in Status, why native Jira and JQL fall short of showing it, and how to set it up using the Duration Between Statuses (DBS) report in Timepiece - Time in Status for Jira.
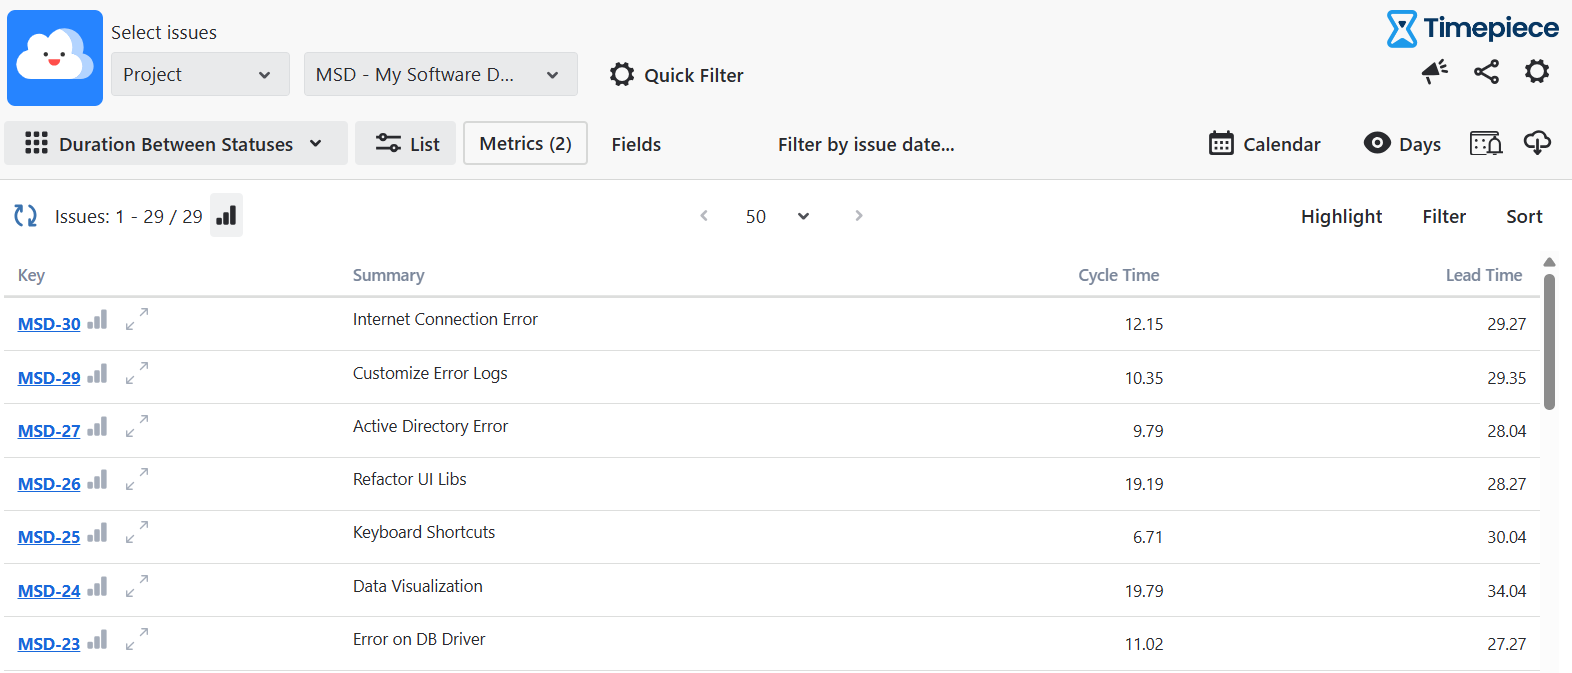
Time in Status vs. Time Between Statuses
The two report types get mixed up constantly, since they sound almost the same, and both come from the same underlying data: an issue's status history.
Time in Status measures how long an issue spends inside one specific status. If a ticket sits in "Code Review" for three days total, that's its Time in Status for that specific ticket.
Time Between Statuses measures how long it takes an issue to get from one point in the workflow to another, regardless of what happens in between. It doesn't ask "how long was this issue in Code Review."
It asks "how long from when this issue entered Code Review to when it left it," or "how long from creation to Done."
|
Time in Status |
Time Between Statuses |
|
|---|---|---|
|
What it measures |
Time spent inside a single status |
Time elapsed between two chosen points |
|
Needs you to name |
Just the one status |
Only the start and stop points, not every status in between |
|
Best for |
Finding which single status is the slowest |
Measuring a stretch of the process as a whole |
|
Typical question it answers |
"How long do issues sit in QA?" |
"How long from code complete to release?" |
To improve delivery, increase efficiency, and better work distribution, most teams end up wanting both. Time in Status points at which a single stage is dragging. Time Between Statuses tells you how a whole stretch of work, often spanning several statuses, is performing as a unit.
Cycle Time and Lead Time, the two most common flow metrics, are really just named examples of Time Between Statuses. Cycle time is usually the time from first entering "In Progress" to reaching "Done." Lead time is usually the time from Issue Creation to "Done." If you want the fuller comparison, we've covered that in our guide to Cycle Time vs. Lead Time in Jira.
Why Native Jira Can't Show You Time Between Statuses
Jira is great at logging every status change in an issue's history. What's missing is a way to turn two of those log entries into a duration you can read, sort, or export.
JQL can find issues that made a transition. A query like status changed to "Done" DURING ("2026-07-01", "2026-07-31") returns every issue that moved into "Done" that month. Atlassian's own support documentation uses the same kind of query to catch stuck issues: status = "In Progress" AND NOT status CHANGED AFTER -3d finds issues that haven't left a status in three days.
Neither query returns a number. They tell you an issue transitioned, or that it's been sitting still. They don't tell you it took 4 days and 6 hours to get from one point to the other, and there's no way to sort a list of issues by that figure, because JQL has no field for it.
Two built-in Jira reports get closer, and both come with a catch. The Control Chart plots how long issues spend in the statuses you select, but it's a team-level trend chart, not a per-issue duration you can filter or export by name.
Jira Software's separate Cycle Time report measures something narrower: the time from a code commit to a production deployment, and it only works once your Jira instance is connected to a CI/CD tool such as Bitbucket Pipelines, GitHub, GitLab, Jenkins, or CircleCI. If your team's process lives in Jira statuses rather than a deployment pipeline, that report has nothing to measure.
The usual workaround is a custom field plus an automation rule: timestamp when an issue enters the start status, timestamp when it enters the stop status, subtract the two.
It holds up until an issue reopens, skips a status, or loops back through the workflow, which is exactly when most teams give up and start exporting issue history to a spreadsheet to calculate it by hand.
Why Time Between Statuses Matters
Data is everything when it comes to identifying problematic processes and workflow inefficiencies in Jira. For data-backed teams, the Time Between Statuses report is crucial.
A Project or Program Manager usually gets the same question from stakeholders, worded each time, "What's the status, and why is it delayed? "
"It's stuck in review" isn't an answer. "It's been in review for 6 days, 2 days longer than our average" is. Time Between Statuses turns a vague update into a specific one, and points at exactly which stretch of the process needs attention.
A Scrum Master or Agile Coach runs retrospectives that work best when grounded in data rather than memory. If the team feels like "Waiting for QA" has turned into a black hole, Time Between Statuses either confirms it or rules it out with a number, instead of leaving it as one more opinion in the room.
An IT or Engineering Lead needs the same visibility without it turning into a surveillance tool. A metric like "time from Ready for QA to QA Passed" describes a step in the process, not a person's speed.
Common Metrics Built From Time Between Statuses
Cycle Time and Lead Time get most of the attention, but they're just two entries in a longer list. Each one is the same underlying measurement, applied to a different pair of points.
|
Metric |
Start Point |
End Point |
|---|---|---|
|
Cycle Time |
First entry to In Progress |
Entry to Done |
|
Lead Time |
Issue creation |
Entry to Done |
|
Queue Time |
Issue creation |
First entry to In Progress |
|
Review Time |
Entry to Code Review |
Exit from Code Review |
|
QA Time |
Entry to Ready for QA |
Entry to QA Passed |
|
Time to Resolution |
Issue creation |
Entry to Resolved |
None of these need a separate tool or a different way of thinking. They're the same calculation: elapsed time between two chosen points. The name just changes depending on which two points you pick and who's asking.
How Duration Between Statuses Works in Timepiece
In Timepiece - Time in Status for Jira, Time Between Statuses is a report type called Duration Between Statuses, or DBS.
You don't have to name every status your workflow might pass through, just the one you want the clock to start at and the one you want it to stop at. Each DBS metric has three parts:
Start At
Where the clock starts. This can be issue creation, one or more statuses, or a date field.
Stop At
Where the clock stops (this one is required). It can be one or more statuses, or a date field.
Paused On (optional)
Any statuses where the clock should pause without ending the metric, useful for taking time spent waiting on a customer or a third party out of the total.
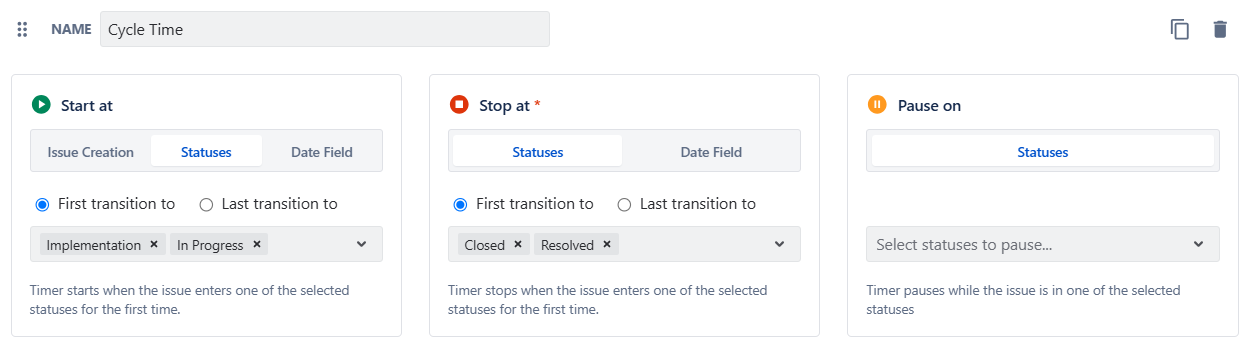
A metric named "Cycle Time," with Start At set to "In Progress" and Stop At set to "Resolved," and Pause on ‘On Hold’, gets calculated for every issue in the report using data that's already sitting in Jira's issue history.
Pro Tip: Start At and Stop At don't have to be statuses. Both also accept a date field, which matters when the timeline your team agreed to doesn't run on the same clock as your Jira workflow. Some teams record the officially agreed start or end date, the one written into a contract or agreed with a customer, directly on the issue instead of relying on when someone updated a status.
Pointing a DBS metric at that field means the report reflects the date your team actually committed to. It's a level of flexibility we haven't seen in other time-between-statuses apps, and Jira Service Management's own SLA configuration doesn't offer it either.
Also, reports can be exported to Excel, Google Sheets, or Power BI when the numbers need to leave Jira for a stakeholder deck.
Automating Alerts When Work Runs Long
A report only helps if someone opens it. Timepiece also has a "Timepiece: Run Report" action inside Jira Automation, which means a DBS metric can trigger something instead of waiting to be checked.
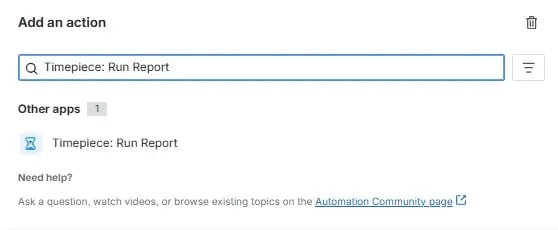
A common setup: build a DBS metric named "Cycle Time," with Start At set to the first entry into "In Progress" and Stop At set to the last entry into "Resolved," save it as a shared report, then build a scheduled Jira Automation rule that runs daily, pulls that report filtered to unresolved issues, and posts a comment on any issue where the value crosses a threshold, such as three days.
From that point on, issues that run long flag themselves instead of waiting for someone to notice during a status meeting. The full walkthrough, including the automation steps, is in the guide to SLA breach notifications via Timepiece integration.
Conclusion
Time Between Statuses is the concept behind Cycle Time, Lead Time, and most other "how long did this part of the process actually take" questions a workflow gets asked. Timepiece's Duration Between Statuses report calculates it directly from Jira's existing issue history.
To learn more about Timepiece - Time in Status for Jira and start a 30-day free trial, visit its Atlassian Marketplace listing. If you have some questions and need a free consultancy meeting with our expert, contact us.

Jira Agile Hierarchy Guide: Tracking Epics, Stories & Tasks

Time-Period Reports in Timepiece – Time in Status for Jira