
By
Melisa Mutlu
on 06/08/2024, 11:09
Last updated on 9/28/26, 10:56 PM

The Status Duration (Time in Status) report shows the total time each issue spent in each status, as a single number per status.Timepiece – Time in Status for Jira also includes two report types that break that total down by time period instead: Status Duration per Time-Period and Time-Period Duration per Status.
Both answer a version of the same question; how much time did each issue spend in each status, per year, quarter, month, week, or day. But they lay the data out differently, and that difference changes what's easy to spot at a glance.
What's the Difference Between the Two Reports?
It comes down to how the columns are grouped. Status Duration per Time-Period groups columns by status first, with time periods nested inside each one.
For example: In Progress → Jan, In Progress → Feb, Code Review → Jan, Code Review → Feb. This makes it easy to follow one status's trend across time, since all its periods sit next to each other.
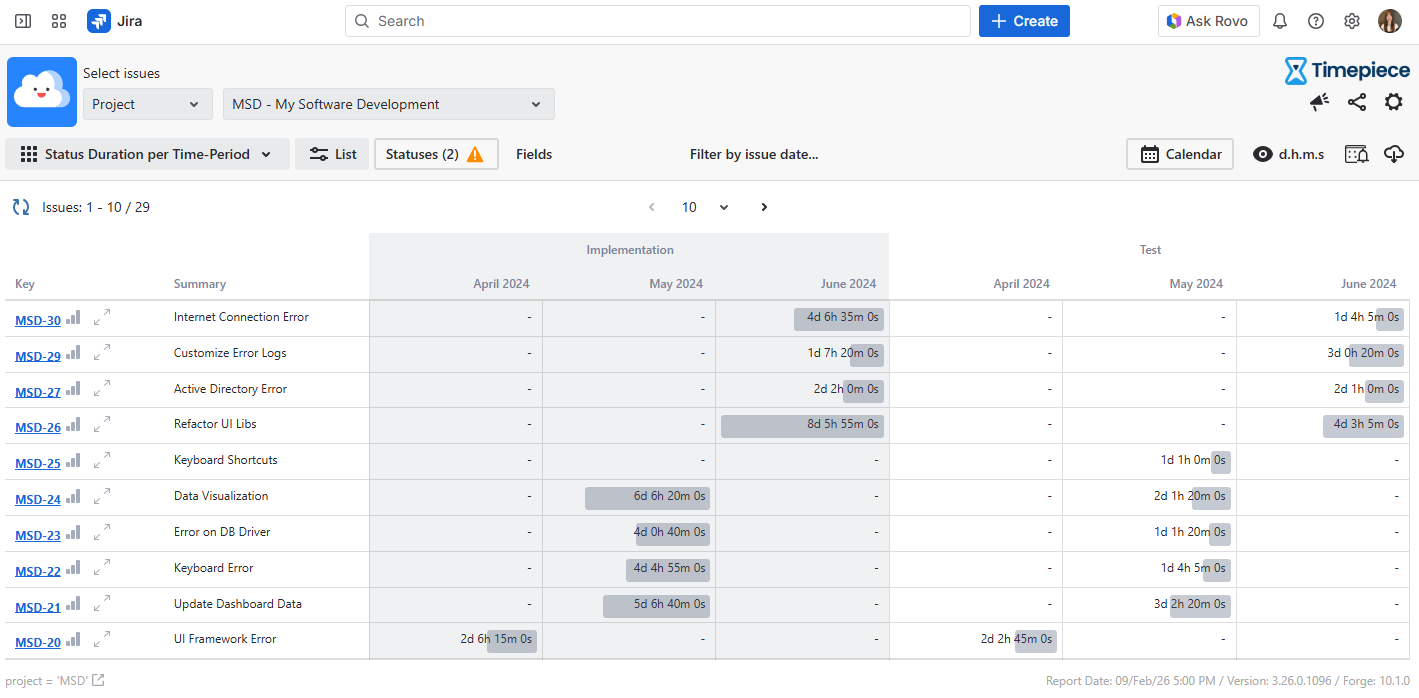
Time-Period Duration per Status groups columns the other way: by time period first, with statuses nested inside. For example: Jan → In Progress, Jan → Code Review, Feb → In Progress, Feb → Code Review.
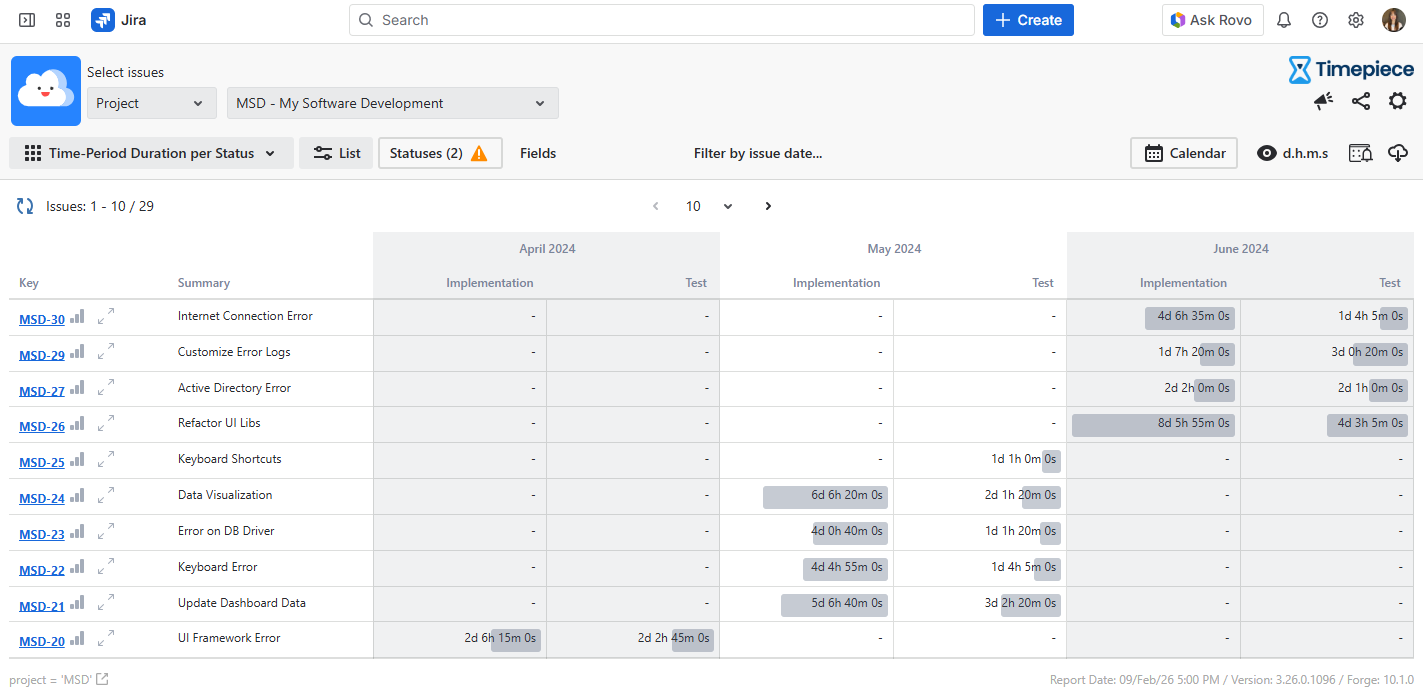
This makes it easy to compare all your statuses within a single period, since everything from one month or week sits together. Same underlying data, two different ways to read it. Pick whichever grouping matches the question you're asking: "how has this status trended over time?" or "what did this period look like across the board?"
Both reports also support excluding specific statuses from the results, the same as the standard Status Duration report.
Using Sum and Average to Get More Out of These Reports
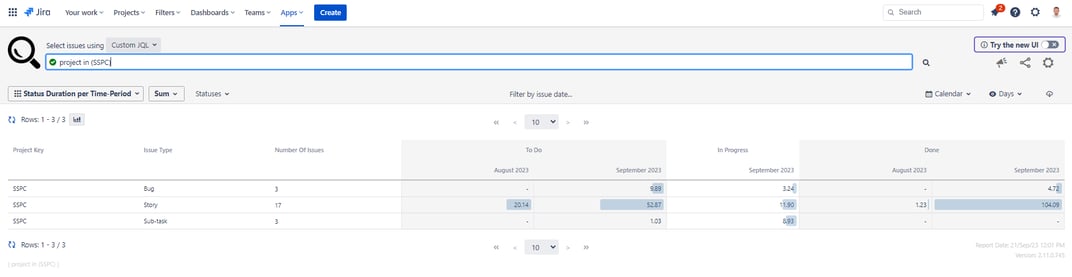
These reports become more useful once you add an aggregation option, Sum or Average, on top. With Sum, you can see the total time cost of each process stage across periods. Useful for questions like "how many total days did Code Review cost us in Q2?"
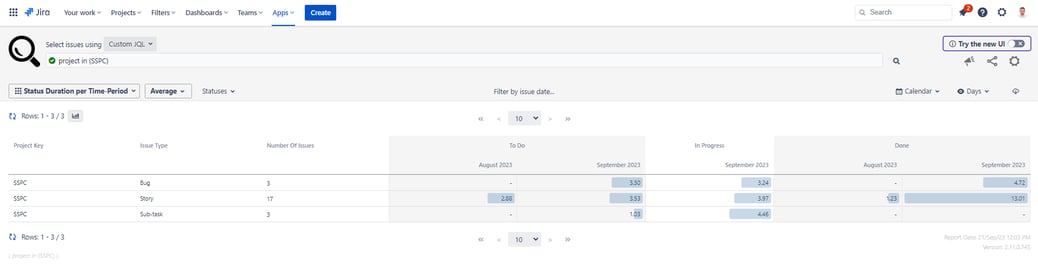
With Average, you can see how a status's typical duration is changing over time. Useful for spotting whether a bottleneck is getting better or worse from one period to the next.
Want to try these reports yourself? Start a 30-day free trial. Timepiece is free on Cloud for teams up to 10 users. You can also book a demo meeting with our experts.

Time Between Statuses in Jira: Meaning & How to Track It

Find Workflow Delays with Timepiece – Time in Status for Jira