By
Emre Toptanci
on 06/08/2024, 11:09
Last updated on 9/28/26, 11:50 PM

Sometimes, you do not need to know every single step a Jira issue takes. You just want to know how long it took to get from Point A to Point B.
If a customer reports a critical bug, you need to measure the time between "Open" and "Resolved" to ensure you meet your Service Level Agreements (SLAs).
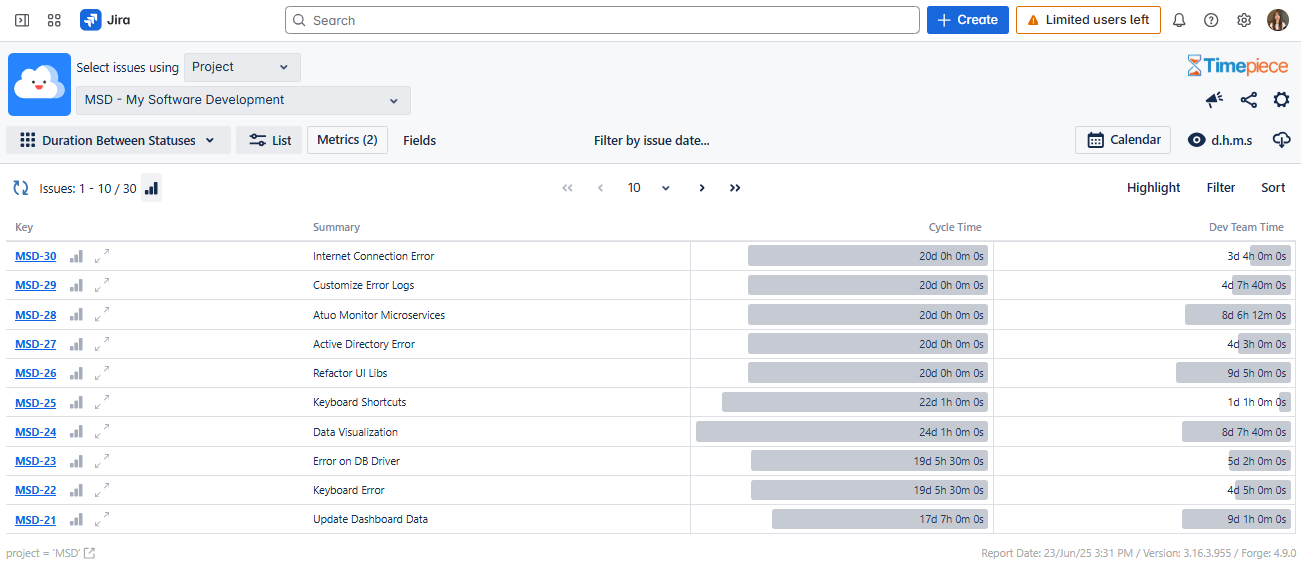
To make this exact measurement easy, Timepiece - Time in Status for Jira includes the Duration Between Statuses (DBS) report.
Time in Status vs. Duration Between Statuses
What makes this report different from a standard Time in Status (Status Duration) report?
The Status Duration Report shows you the time spent in each status. Even if you use consolidated columns to group steps together, you still have to manually account for all the middle steps.
The Duration Between Statuses report is much simpler. You define a starting point and an ending point. The report shows the total time between those two points, completely ignoring the individual statuses the issue passed through in the middle.
What is an SLA?
An SLA (Service Level Agreement) is an external agreement between a service provider and a customer. It defines the exact level of service the customer can expect. SLAs typically measure system uptime, first response times, and total resolution times. For example, if your company promises to fix critical server outages within 4 hours, that target is an SLA.
It sets expectations and often includes penalties if those targets are missed.
What is an OLA?
An OLA (Operational Level Agreement) is an internal agreement between different teams or departments within the same organization. OLAs ensure that your internal teams support each other fast enough to meet your external SLAs. For example, to meet that 4-hour SLA with your customer, your support team might need the database team to review server logs within 1 hour. That internal 1-hour deadline is an OLA.
| Feature | SLA (Service Level Agreement) |
OLA (Operational Level Agreement)
|
||
| Target Audience | External customers or clients |
Internal teams and departments
|
||
| Primary Goal | Define exactly what the customer receives |
Ensure internal teams support each other
|
||
| Visibility | Public (part of the customer contract) |
Private (internal company document)
|
||
| Example | "We will resolve critical bugs in 4 hours." |
"Tier 2 will reply to Tier 1 in 45 minutes."
|
When using Jira reporting tools like Timepiece, you track SLAs to prove you are delivering on your promises to customers. You track OLAs to find out which internal team is causing bottlenecks.
Why use Duration Between Statuses?
This report is built specifically for tracking high-level performance metrics. Use cases include:
SLA and OLA Tracking
Start at "Waiting for Support" and stop at "Resolved" to measure total resolution time, regardless of how many internal handoffs occurred.
Cycle Time
Start at "In Progress" and stop at "Done" to measure pure production speed, completely ignoring time spent sitting in the backlog.
Lead Time
Start at "Issue Creation" and stop at "Done" to track the entire wait time from the customer's perspective.
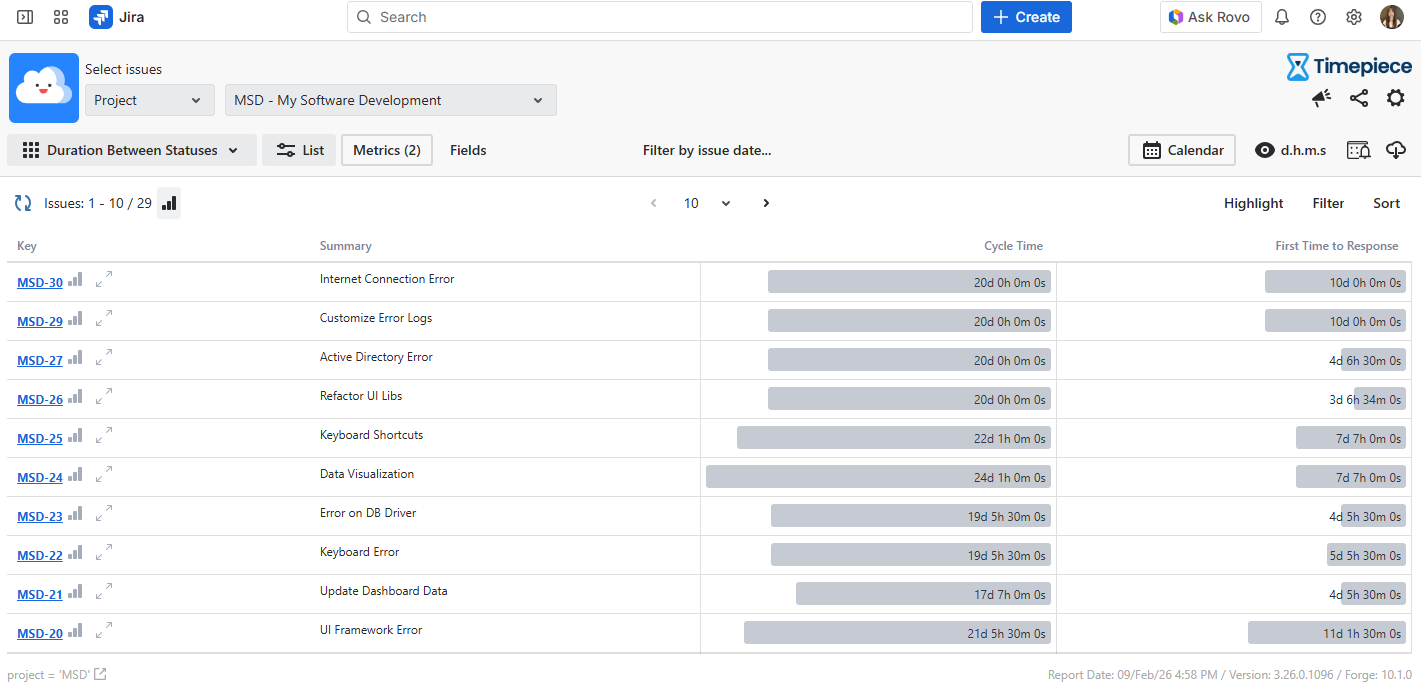
Time to First Response (TTFR)
Start at "Issue Creation" and stop at "In Review" to ensure your triage process is fast and new requests are not ignored.
QA Validation Time
Start at "Ready for QA" and stop at "Passed" to measure exactly how long testing takes, separate from active development.
Approval Delays
Start at "Pending Approval" and stop at "Approved" to track administrative bottlenecks that are holding up your workflow.
How to set up your metrics
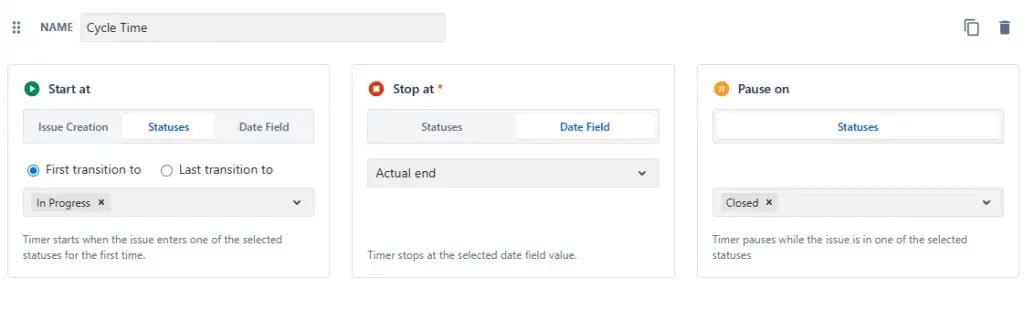
You have complete control over how the clock runs. When you select this report type, click the Metrics button to define your columns. For each metric, you will configure:
Name: This becomes the column header on your report.
Start At: Tell the metric where to begin counting. You can select Issue Creation, a specific date field, or one or more statuses (like "Open").
Stop At: Tell the metric where to stop counting. You can select one or more statuses (like "Closed") or a specific date field. You cannot leave this blank.
Paused On (Optional): If a ticket goes into "Waiting on Customer," you do not want that time counting against your SLA. Select statuses here to pause the timer.
Pro Tip: Issues often bounce back and forth between statuses. Timepiece lets you choose whether the metric starts or stops on the First or Last visit to a status, keeping your data accurate even if a ticket goes through QA testing three times.
Reading your report at a glance
When you generate the report, Timepiece uses clear visual indicators so you instantly know the state of your metrics:
Not Started: The issue hasn't reached your starting point yet. The field remains empty.
Running: The issue passed the start line but hasn't reached the finish line. You will see the current duration calculated up to the present moment, marked with a running man icon.
Paused: The metric started but is currently sitting in one of your "Paused On" statuses. The clock is stopped, marked with a pause icon.
Completed: The issue reached your "Stop At" point. You will just see the final calculated time.
Try Timepiece - Time in Status for Jira for free on the Atlassian Marketplace today. Or book a one-on-one demo with our experts.

New release loaded with features for Time in Status for Jira Server and DataCenter

New in Timepiece: Custom Columns for Any Field Reports