
By
Birkan Yildiz
on 26/03/2026, 10:46
Last updated on 9/28/26, 10:56 PM

More reports doesn’t mean better visibility. Yes, data is everywhere nowadays, but ‘'real insights'' are often hard to find. To lead a high-performance team, you need a single-screen Command Center that transforms raw data into Key Performance Indicators (KPIs), measurable values that demonstrate how effectively your team is achieving its delivery goals.
In this guide, we will explain how to build a high-performance Jira dashboard that specifically tailored for Agile Product Development. The main purpose is creating a single screen Command Center with Timepiece - Time in Status for Jira’s advanced time tracking gadgets and Jira’s native reports.
The Agile KPI Framework: Four Critical Monitors
A professional dashboard must balance different dimensions of performance. Our Command Center act as the primary KPIs for Agile success. The dashboard will feature 4 critical monitors:
Efficiency by Story Size: Lead Time & Cycle Time (powered by Timepiece)
Flow & Health: Sprint Health Gadget (Native Jira)
Team’s Sprint Performance: Assignee Duration (powered by Timepiece)
Execution: Sprint Burndown Gadget (Native Jira)
Why You Need a Centralized KPI Dashboard in Jira?
Before we dive into the configuration, let’s talk about efficiency. Digging through the Jira sidebar to find 4 different reports is a friction point that kills analysis. A well-designed Jira Dashboard solves this by acting as your team's Information Radiator.
Here is why this matters:
Simultaneous Insight: View multiple reports side-by-side. You can instantly see how a spike in workload impacts your Cycle Time without switching screens.
Zero-Friction Updates: Stop reopening reports to check for changes. Just hit refresh. This turns a 10-minute audit into a 10-second glance.
The Morning Ritual: Make this the first screen you see every day. It sets the context for your work before the daily stand-up even begins.
Team Alignment: Share the dashboard with your entire team. When everyone looks at the same real-time data, transparency becomes automatic.
Step-by-Step Guide: How to Build the KPI Command Center in Jira?
Begin with a blank canvas.
Go to Dashboards in the left navigation bar and select + button to create a new dashboard.
Name it clearly, let’s say KPI Monitoring.
Pro Tip: Choose a Two-Column Layout. This offers the best balance, allowing charts like the Sprint Health and Cycle Time to be wide enough to read while keeping everything visible.
How to Configure the Gadgets?
Efficiency KPIs: Lead Time & Cycle Time (Timepiece)
Native Jira reports often struggle with Time in Status because they count weekends and non-working hours, skewing your data. We will use the Timepiece app gadget to solve this using Custom Calendars and precise status grouping.
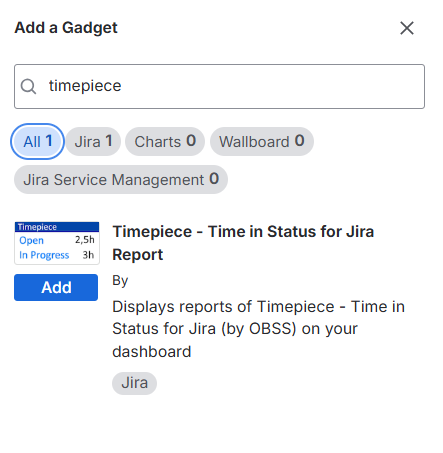
Add the Gadget: Search for Timepiece - Time in Status for Jira in the gadget directory.
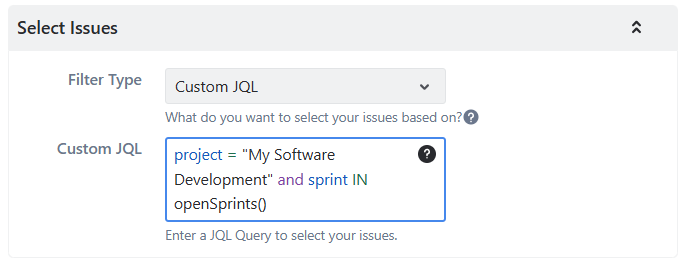
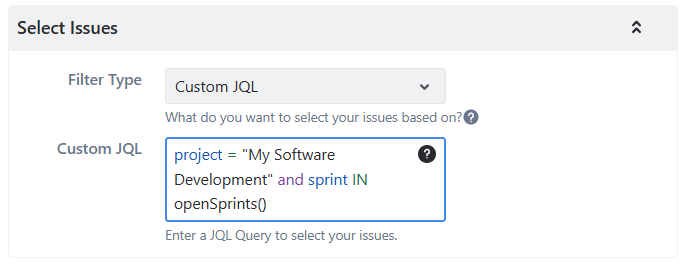
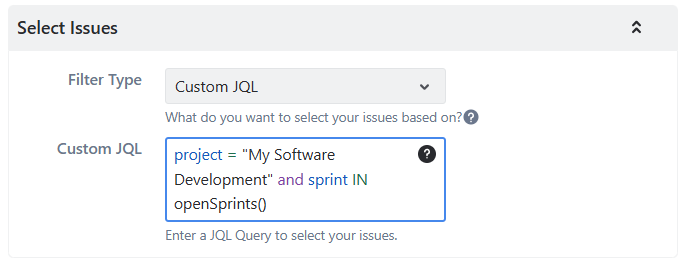
In the Select Issues, select Custom JQL and filter your issues.
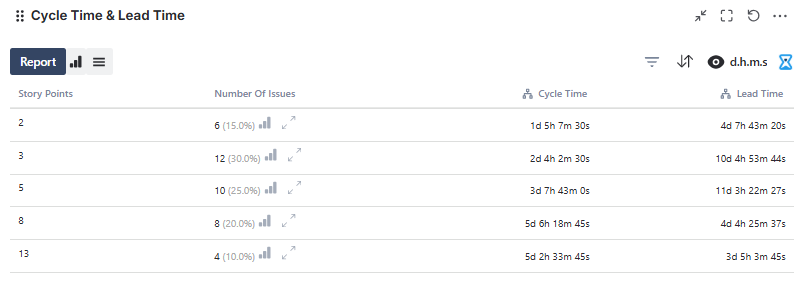
Then, set the Report Type to Status Duration. Then, select Average as the Data Type and group by Story Point. Grouping Status Duration by Story Point is essential for validating if your team's estimations (3SP, 5SP, etc.) correlate with the actual time spent working.
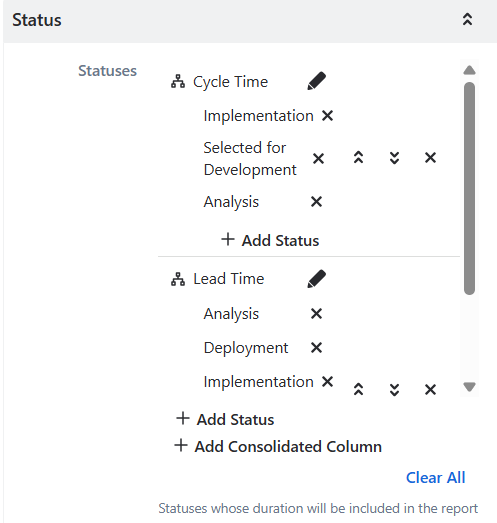
Then, in the Status menu, add 2 new Consolidated Columns.
Why? You don't want to see every single status. Instead:
Cycle Time: Group your active statuses here (e.g., Implementation, Selected for Development, Analysis).
Lead Time: Group all statuses from start to finish (e.g., Backlog, Analysis, Implementation, Selected for Development).
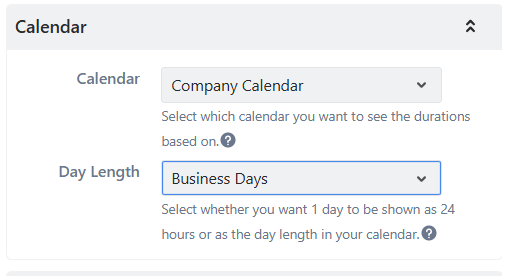
Calendar: Select your team's "Working Hours" calendar to exclude weekends/nights from the data, ensuring you measure effort, not just elapsed time.
Here is the result:
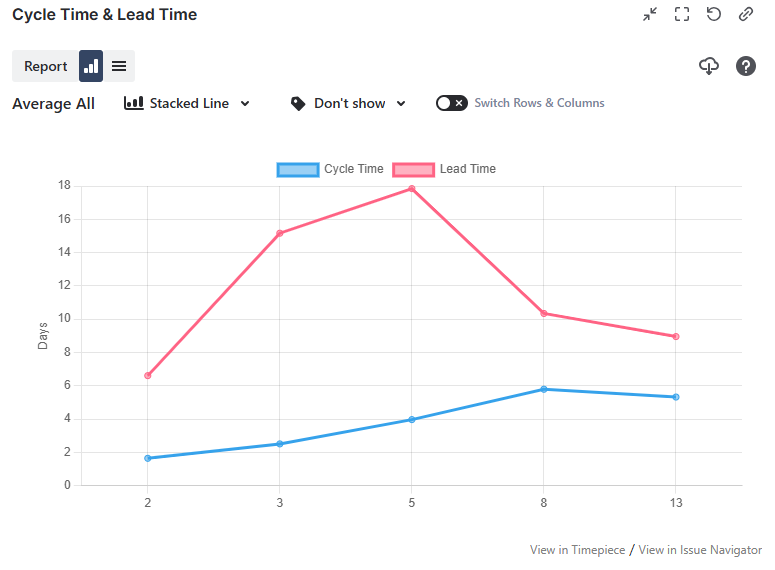
Pro Tip: After setup, choose your preferred view from the top left for chart view: List, Bar, Line, or Column.
Stability KPIs: Sprint Health Gadget (Native)
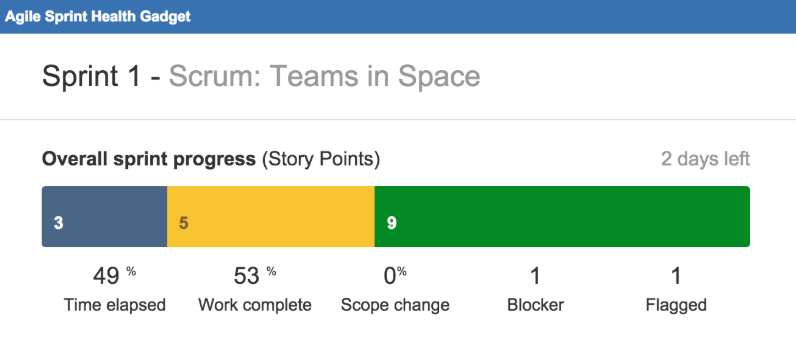
This native gadget tells you if your team is keeping up with demand or slowly drowning in technical debt.
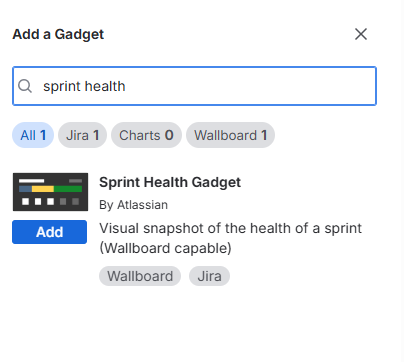
Add the Gadget: Search for Sprint Health Gadget by Atlassian.
Select your preferred board and toggle the checkboxes to complete the setup.
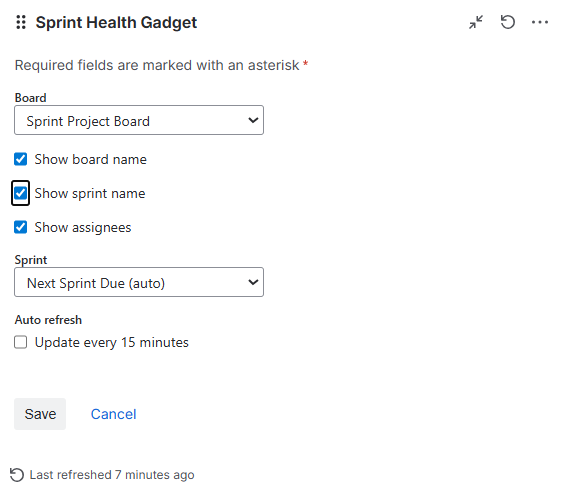
Here is how it looks:
Resource KPIs: Assignee Duration
Add the Timepiece gadget one more time.
This time, instead of "Status Duration", choose ''Assignee Duration" in the Report Type settings.
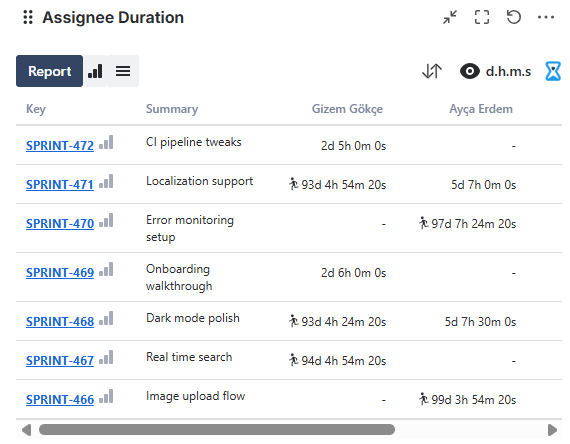
This instantly allows you to track how long issues reside with each assignee using Jira’s issue history. That means no need for manual time logging. It highlights where work is lingering, allowing managers to identify team members with the highest task durations and redistribute tasks to ensure sprint stability.
When assignee durations accumulate heavily on specific individuals, it indicates they are struggling to keep up with their assigned tickets, signaling an unbalanced workload. Rather than relying on simple estimates based on ticket counts, this provides a more accurate picture by measuring actual elapsed time. You can learn learn more about workload distribution reports in Jira and how to avoid burnout.
Here is how it looks:
Predictability KPIs: Sprint Burndown Gadget
Finally, we need to track the current iteration's heartbeat.
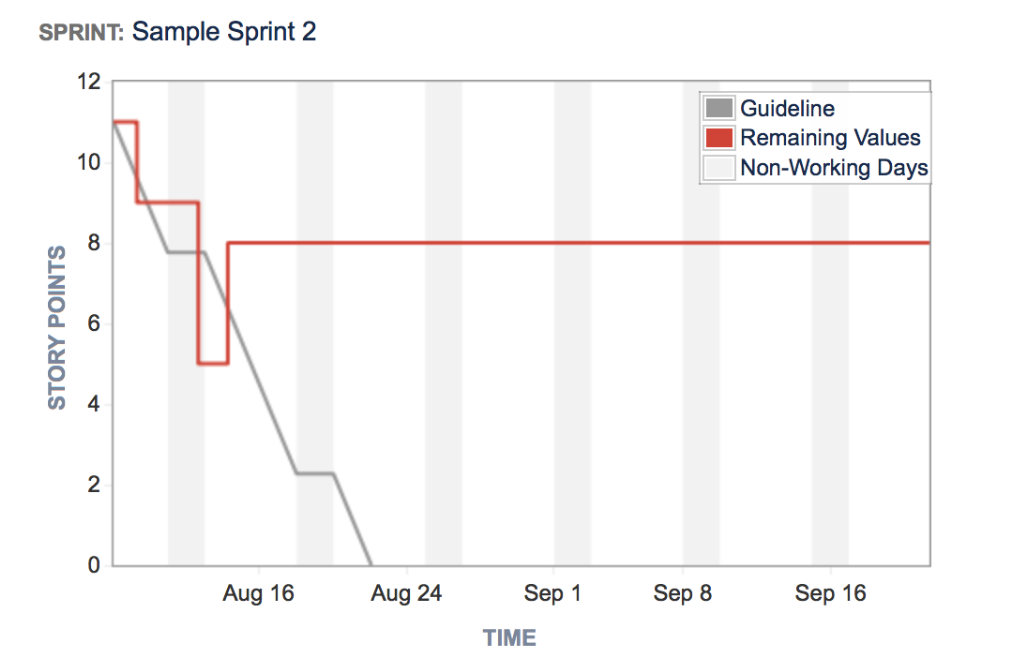
Add the Gadget: Search for Sprint Burndown Gadget.
Board: Unlike other gadgets that use filters, this one requires you to select your Scrum Board.
Sprint: Set this to "Auto" or "Active Sprint". This ensures the gadget automatically updates when you close Sprint 1 and start Sprint 2, so no need for manual reconfiguration.
Here is how it looks:
You now have a central hub to track performance.
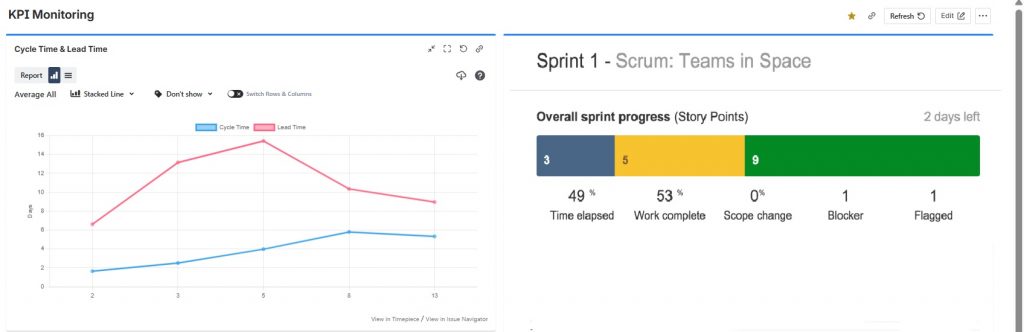
Use it to keep stakeholders aligned with trusted data and visualize your most important metrics in seconds.
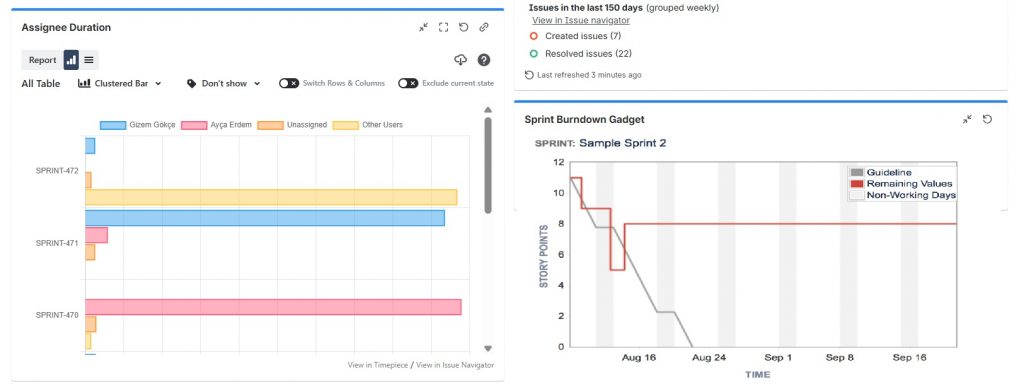
By setting up this 4-gadget dashboard, you transform Jira from a simple ticketing system into a strategic command center. You no longer need to hunt for answers; the answers are waiting for you the moment you log in.
Pro Tip: Quality KPIs with Transition Count
To track Quality and Requirements Clarity, add the Transition Count report from Timepiece. A high number of transitions (the "Ping-Pong Effect") between In Progress and QA is a KPI for high technical debt or unclear acceptance criteria. For a deeper dive into KPI theory and how to leverage Timepiece for even more granular metrics like "Transition Count," read this blog post.
Conclusion: Data-Driven Agile Leadership
By building this 4-monitor Command Center, you transform Jira into a strategic asset where Lead Time, Cycle Time, Scope Stability, and Resource Capacity are tracked as empirical, reality-based KPIs. With Timepiece’s ability to correlate Time in Status with Story Points and custom calendars, you ensure your KPIs reflect actual team effort.
To learn more about Timepiece - Time in Status for Jira, visit its Atlassian Marketplace page. You can also visit the official Timepiece documentation page or book a online demo meeting.
FAQs
What is the "Scope Creep" KPI in Jira?
Scope creep is tracked via the Sprint Health Gadget. It identifies when new work is added to a sprint after it has started, which is a key indicator of poor requirements gathering or backlog grooming.
How do I identify a "Bottleneck User" with a KPI?
Use the Assignee Duration report in Timepiece. If one person consistently has the highest average duration for tasks, they are a "bottleneck user," indicating a need for knowledge sharing or task redistribution.
What is the "Ping-Pong Effect" KPI?
It is measured using the Transition Count report in Timepiece. A high count of transitions between statuses like In Progress and QA is a KPI for low-quality requirements or high technical debt.
How can I measure "Blocked Time" as a KPI?
Using Timepiece, you can group "Blocked" or "On Hold" statuses into a consolidated column. This acts as a KPI for the financial cost of dependencies and external delays.
How to share my KPI dashboard with stakeholders?
Jira dashboards can be shared with specific projects or roles. Ensure the underlying JQL filters and Timepiece configurations are also shared so stakeholders see the same real-time data.

Jira Rework Analysis: How to Detect Status Churn and Quality Issues

How to Deduct Flagged (Blocked) Time from Cycle Time and Lead Time in Jira