
By
Birkan Yildiz
on 14/07/2026, 13:32
Last updated on 9/28/26, 11:13 PM

For engineering leads, Scrum Masters, and operations directors, workflow velocity is the core baseline of successful delivery. When projects past their deadlines or teams face burnout from shifting priorities, the root cause is almost always a hidden bottleneck in your pipeline.
To identify these delays and optimize your processes, you need data-backed insights, not gut feelings. The most critical starting point for this analysis is a specialized metric: Average Time in Status.
What is Jira Average Time in Status?
Jira Average Time in Status is a core workflow metric that calculates the mean duration an issue spends within specific stages of your process. By tracking Average Time in Status, organizations can calculate precise Cycle Time and Lead Time, and Resolution Time. This establishes realistic Service Level Agreements (SLAs) and improves overall predictability. While Jira Cloud provides built-in tools to track these durations, they come with drawbacks. Relying on them blindly without understanding their limitations can lead to inaccurate dashboard reports. This guide explores the built-in methods for calculating Average Time in Status in Jira Cloud, explains the workflow traps you will inevitably encounter, and maps out a scalable path to enterprise-grade reporting.
How to Track Status Time with Native Jira Gadgets
The quickest way to visualize transition metrics is to use Jira Cloud's pre-installed charting gadgets. These gadgets query your transition logs to display average duration data directly on your dashboard.
Jira Cloud provides 3 native gadgets designed to measure workflow age and durations:
Average Time in Status: Displays a trendline chart calculating the average number of days work items spent in selected workflow statuses.
.png?width=1018&height=700&name=time%20in%20status%20average%20(1).png)
Average Number of Times in Status: Displays the average count of times work items have transitioned back into a specific workflow state.
.png?width=641&height=635&name=Average%20Number%20of%20Times%20in%20Status-jira-gadget2222%20(1).png)
Average Age Chart: Plots a bar chart of the average number of days that active, unresolved work items have remained open.
.png?width=834&height=553&name=averageagechart%20(1).png)
How to Configure the Native Average Time in Status Gadget?
To set up the native "Average Time in Status" gadget on your dashboard, you must define several precise parameters within the configuration panel:
Project or Saved Filter: Limit the data lookup to a defined set of issues.
Statuses: Select the specific workflow statuses you want to track.
Period: Choose the time interval for your chart x-axis (Hourly, Daily, Weekly, Monthly, Quarterly, or Yearly).
Average Duration: Choose whether you want the y-axis to display the average time in hours or days.
Days Previously: Set the number of days you want the gadget to search back (e.g., 30, 90, or 180 days).
Refresh Interval: Determine how often the gadget re-queries Jira for fresh data (from "Never" up to "Every 15 minutes").
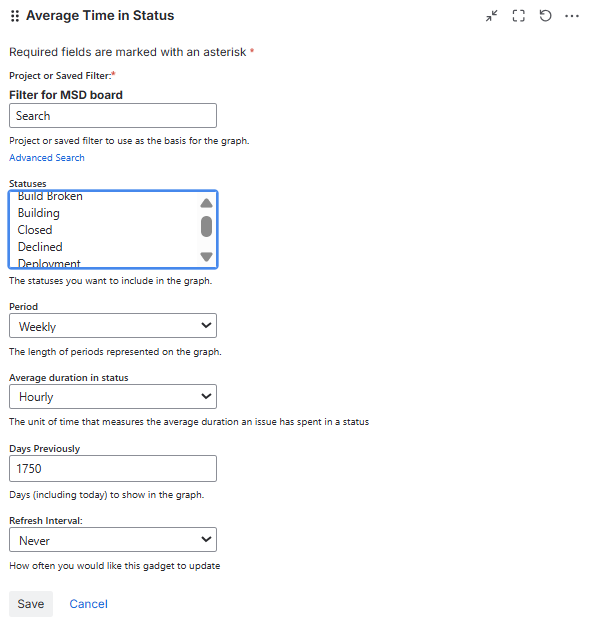
You can apply these exact same configuration steps to set up the other native gadgets mentioned in this guide, though keep in mind that the Average Age Chart will not require you to select specific statuses as it evaluates all unresolved statuses globally.
Limitations of Native Jira Gadgets
Despite their convenience, built-in dashboard gadgets has operational limitations. For growing organizations, these limitations frequently skew metrics.
Date Dependencies (Created vs. Resolution Dates)
A major structural limitation of native gadgets is their absolute reliance on fixed system date fields. You cannot choose which date field Jira uses to group, map, or calculate your workflow timeline:
The Average Time in Status Gadget operates strictly based on the system Resolution Date. It only calculates durations for work items that have reached a completed state.
The Average Age Gadget operates strictly based on the system Created Date. It calculates the age of unresolved issues as the difference between the current date and their creation timestamp, plotting them over time starting from their creation date.
The Resolution Bias
Because of the gadget's dependency on the system Resolution date, it has a strict resolution bias. The gadget's calculation engine only computes durations for work items that have reached a completed state.
If your team has 10 critical issues currently stuck in "In Review" for three weeks, but one issue was quickly completed in a single day, the gadget will only calculate the time spent on the single completed issue. Your active, ongoing bottlenecks remain completely invisible, leaving you blind to active Work in Progress (WIP).
Workflow Discrepancies
The native gadget relies on strict uniformity. According to official Atlassian bug tracking (JRACLOUD-75778), the gadget displays profoundly inaccurate results in projects where different issue types utilize different workflows. If you select a workflow status that is not common among all issue types within your project, the gadget fails to determine the proper resolution status, resulting in broken charts or missing data.
No Business Calendars
Native Jira Cloud dashboard gadgets calculate status durations based on a continuous 24/7 calendar. They lack the configuration to exclude weekends, holidays, or non-working hours. If an issue enters "QA Testing" on Friday afternoon and exits on Monday morning, the gadget registers three full days instead of a few working hours, heavily inflating your Cycle Time.
Enterprise Cloud Reporting: Atlassian Analytics
For organizations utilizing Jira Cloud Enterprise, Atlassian Analytics provides a modern reporting interface that bypasses traditional dashboard limitations. Utilizing the Atlassian Data Lake, it offers 2 pre-built dashboard templates for status metrics:
Time in Current Status Template: Isolates active bottlenecks by analyzing how long currently open Jira work items have been languishing in their present "To Do" or "In Progress" state.
Time-in-Status History Template: Evaluates how much time open work items have spent in both their current and past historical statuses to measure structural efficiency gains over time.
How Can You Use Jira Automation and Agile Boards as Native Workarounds?
When Enterprise analytics are unavailable, teams frequently turn to native workarounds to bridge the gap.
Board-Level Dots: Agile boards offer a "Days in column" feature that displays dots on issue cards indicating how many days an item has been in that column. However, this is limited to raw 24/7 days and offers no detailed averages.
Event-Driven Custom Fields: Administrators often build complex Jira Automation rules that stamp a custom "Date/Time" field when an issue enters a status, and calculate the difference when it exits. Tracking an entire workflow this way requires maintaining dozens of custom fields and rules, which clutters issue screens and quickly exhausts your monthly Jira automation run limits. Furthermore, you cannot configure built-in dashboard gadgets to group, sort, or aggregate metrics using these custom automation fields.
Bypass Native Limitations with Timepiece
As workflows become more complex, teams quickly outgrow native Jira Cloud reporting. Built-in gadgets hide active work, Atlassian Analytics is locked behind Enterprise tiers, and custom automation drains system limits.
This is why teams rely on Timepiece - Time in Status for Jira. Timepiece instantly turns raw Jira issue histories into actionable process intelligence. Here is how Timepiece solves native reporting limitations out of the box:
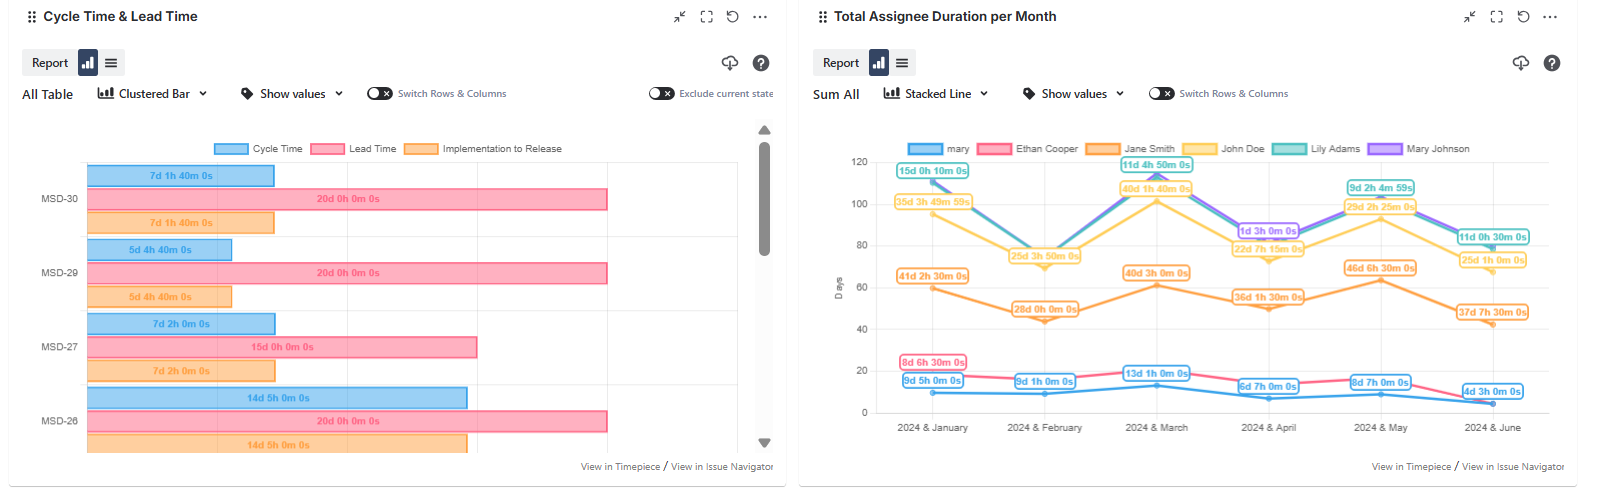
Eliminate Resolution Bias: Timepiece can track both resolved and unresolved issues side-by-side, allowing you to see exactly where current sprint work is stalling.
Define Custom Business Calendars: Define custom calendars that exclude weekends, public holidays, and non-working hours. Your metrics reflect actual operational effort rather than raw elapsed calendar time.
Fully Interactive Dashboard Gadgets: Every report type in Timepiece functions as a dynamic dashboard gadget. Unlike built-in gadgets, dashboard viewers can drill down into specific issue details, sort, and filter the data dynamically.
Learn how to build a powerful Time in Status dashboard with Timepiece, step by step.
Average Time in Status for Predictable Jira Workflows
Tracking Average Time in Status in Jira Cloud is the most effective way to find hidden workflow bottlenecks and improve your team's Cycle Time. While native Jira dashboard gadgets offer a quick starting point, their limitations can make it difficult to see the true state of your active work.
To get accurate, actionable data, you must account for these built-in blind spots. Whether you rely on advanced features like Atlassian Analytics, build out custom automation rules, or use dedicated marketplace apps with business calendar support, moving past basic reporting ensures your team can finally measure real operational effort. By understanding exactly how long work spends in each status, you can streamline your processes and deliver software more predictably.
Explore Timepiece - Time in Status for Jira today and start your 30-day free trial. You can also book a demo meeting.

Jira Average Time in Status: Choosing Your Denominator

Jira Performance Analytics: Measure Throughput, Cycle Time, and Rework