
By Emre Toptanci on 06/08/24 11:09
Last updated on 6/12/26 12:15 PM

Staring at a massive table of Jira reporting data makes it hard to spot bottlenecks quickly. While Timepiece - Time in Status for Jira already provides charts and data bars to help you visualize metrics, sometimes you need critical numbers to simply jump off the screen.
That is exactly why we built the Highlight Cells feature. Instead of manually scanning rows for delayed tasks or breached SLAs, you can now set conditional rules to automatically color-code your data.
What is the Highlight Cells feature?
The Highlight Cells feature allows you to set custom formatting rules that apply predefined colors to specific cells or entire rows. If a value crosses a threshold you care about, the report highlights it automatically so you never miss an important metric.
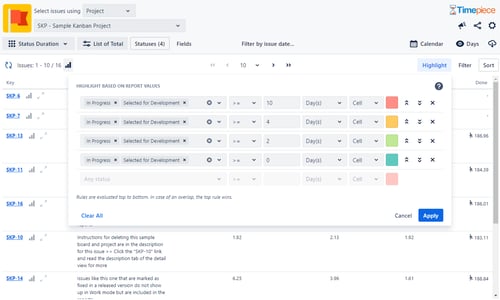
How to Configure Highlighting Rules
You have complete control over how your data is color-coded. You can set up multiple rules to fit your exact reporting needs:
-
Set custom thresholds: Assign specific colors based on duration limits (for example, turn a cell red if an issue stays in "In Progress" for more than 48 hours).
-
Target specific columns: Apply your highlighting rules to a single column or across multiple columns simultaneously.
-
Color the cell or the entire row: Choose whether to highlight a single data point or paint the entire row to draw maximum attention to a specific issue.
-
Layer your rules: You can combine configurations for maximum flexibility. For example, you can highlight an entire row yellow based on one rule, but color a single cell within that row red based on a separate rule.
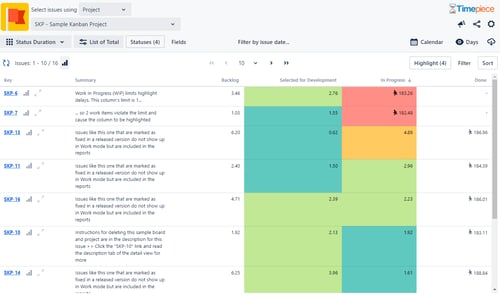
This update gives you the flexibility of spreadsheet-style conditional formatting, directly inside your time in status reports.
After you set your rules, the report results will highlight cells accordingly.
Available Now for Jira Cloud
The Highlight Cells feature is officially live for Timepiece on Jira Cloud. You can open your reports and start setting up your conditional formatting rules today.
If your team is on Jira Data Center, hold tight. Our engineering team is actively building this functionality for Data Center environments, and we will announce it in an upcoming release.
Stop Skimming and Start Analyzing
Manually scanning rows of raw data takes time away from actually fixing project bottlenecks. By applying custom highlight rules directly to your Timepiece reports, you force the most critical information, such as stalled tickets or at-risk SLAs, to the surface automatically.
Try setting up your first color-coded threshold today to see how much faster you can review your Jira metrics. As always, if you have any feedback or need help configuring your tables, our support team is just an email away.
Visit Timepiece's Atlassian Marketplace page to learn more.

How to Deduct Flagged (Blocked) Time from Cycle Time and Lead Time in Jira

Achieving a 360-Degree View of Time Tracking in Jira

No Comments Yet
Let us know what you think