
By OBSS Apps Team on 06/08/24 11:09
Last updated on 6/5/26 1:47 PM
With this week’s release of Timepiece - Time in Status for Jira Cloud, we are introducing additional capabilities to Jira dashboard gadgets previously only available on the Timepiece main reporting screen.
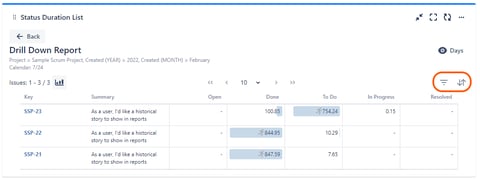
Drill Down
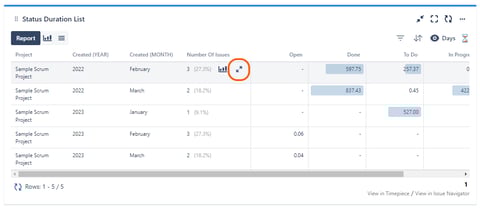
Timepiece Jira dashboard gadgets now have Drill-down capability.
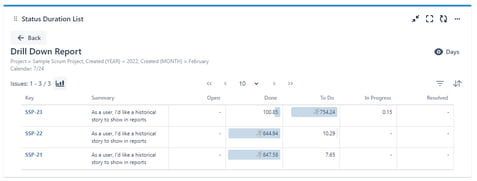
Using this feature, the viewer can drill into the details of aggregate (average, sum, median, standard deviation) reports and see the individual issues that make up an aggregate report row.
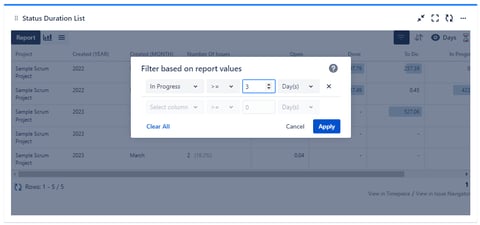
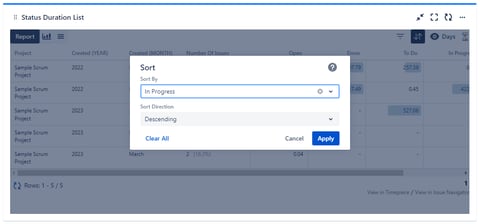
Filter and Sort
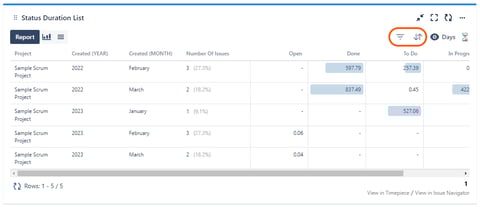
Timepiece dashboard gadgets now also allow the viewer to change the Filter and Sort settings of the data in the gadget.
Previously, filters and sorting were set as part of the gadget configuration. You had to change the configuration of the gadget to change them. Now, the viewer change the filter and sort settings directly through the dashboard. The gadget will return to its configured settings when the page is refreshed.
Filter and Sort options are also available when you drill down to the details of an aggregate report.
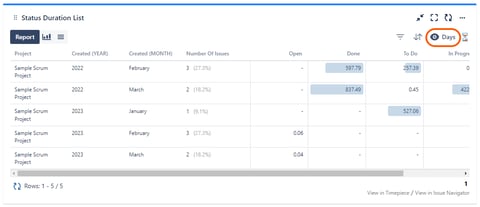
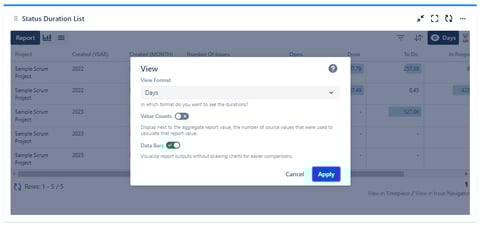
View Options
Finally, dashboard gadgets now also allow the viewer to change the View Options of the gadget.
You can change the View Format (days, hours, minutes, etc.), enable/disable Data Bars, and show/hide Value Counts (for supported report types).
Final Words
These new features are currently available only for Timepiece Cloud. Jira DC features are in the works.
If you have further questions, you can reach the OBSS support team through appsupport.obss.com.tr or send an e-mail to appsupport@obss.tech

Dashboard gadget for Cloud

Adding Issue Fields to Dashboard Gadgets - Timepiece - Time in Status for Jira

No Comments Yet
Let us know what you think